The Easy Way to Make Sense of Your Marketing Nonsense
Part 1: Building a Simplified Marketing Dashboard That Doesn’t Suck
I’ve lost count of how many business owners or marketing managers I’ve talked to who have absolutely no clue how their marketing investments are performing (if they’re performing at all). I get it, if you’re a smaller company with limited resources, making sense of all the makreting performance nonsense (engagement, anyone?) can be overwhelming. But here’s the kicker, even the big guys don’t always know which marketing channels are actually delivering results.
Today, my goal is simple: to help you build a straightforward reporting dashboard that’ll show you exactly how your marketing efforts are performing, without the unnecessary complexity.
But first, let me tell you why this is important (based on my experience).
Why This Is Important
First, you might not be sure if marketing is actually bringing in sales or any real value. As a business owner, you might be spending money on marketing campaigns, but if you’re not seeing direct sales, how can you tell if it’s worth it?
Secondly, your fancy-pants agency might be bragging about all those engagements, impressions, traffic, and all sorts of other metrics that don’t mean shit. You’re spending hundreds (or even thousands) on ads, only to find out that all the clicks and likes aren’t turning into conversions or revenue.
Finally, you’re unsure if your marketing budget is being spent wisely. You have campaigns running across Google Ads, Facebook, and email, but how can you tell which one is actually bringing in the money?
A good reporting dashboard gives you a clear picture of your marketing performance across all channels. It strips away the fluff, like impressions and engagement, and focuses on the metrics that really matter, like conversions and cost. With this, you can easily track where your money is going and make smarter decisions.
Defining the Key Metrics in Your Funnel
Let’s use some common sense to identify the most important things we need to track. Imagine you own an e-commerce shop. Now, let’s work backward from the end result, which, in this case, is sales.
Our ultimate goal is to get a sale.
Before someone makes a purchase, they need to visit the checkout page.
Before someone visits the checkout page, they need to add something to their cart.
Before they can add something to their cart, they need to see and learn about our product.
And in order for them to see our product, they need to visit our website.
Now, assuming you’re not Coca-Cola or H&M, most people don’t know you exist, and they won’t just randomly type in your website URL. For them to visit your site, they need to click on something that leads them there, usually an ad or some form of organic placement.
Finally, for someone to click on something, that “something” has to be seen in the first place. So, the ad or placement needs to be shown (reach) to the right people.
Here you go - you just mapped out a journey that customer has to take to make a purchase.
Building the Simplified Funnel
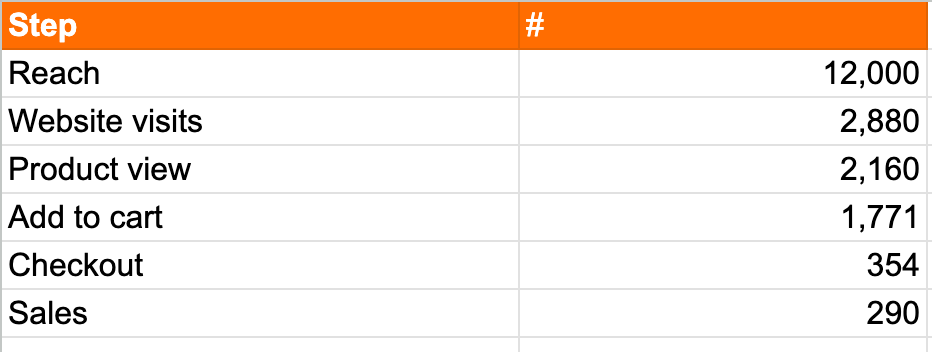
So, now we can turn this customer journey into our simplified funnel:
1. Reach
2. Website visits
3. Product view
4. Add to cart
5. Checkout
6. Sale
Now, by using the magical powers of sheets, let’s make a nice table like the one below and add those numbers. Most of you should have these easily accessible (if not, I can help).
Adding Context to Your Metrics
Okay, you’ve got all these numbers. Is it good? Bad? What now?
To answer this, we need to add more context.
This will allow us to understand if our performance is good or bad. First, we need to add the missing pieces.
We need to know how much we’re spending (cost), and we need to know how much we’re making in sales (sales value).
If you’re selling different products at various price points, it’s also helpful to understand the average value per sale, which is calculated as:
Average Sale Value = Total Sales / Number of Sales
Finally, we need to understand how much money we’re getting for each dollar we spend on marketing. For that, we need to calculate ROAS (Return on Ad Spend):
ROAS = Sales Value / Cost
In our case, for every $1 we spend on marketing, we get $1.70 worth of sales. Keep in mind, this is not the true ROAS, as it doesn’t account for other costs and expenses, but we’ll cover that in the next part. However, we can already tell if we’re making ends meet. If our ROAS were less than $1, that would indicate we’re spending more than we’re earning.
As an alternative, we can also calculate Cost per Sale, a more commonly used metric for non-revenue actions like leads, registrations, or free trials, but it works here too. To calculate Cost per Sale, divide your total cost by the number of sales:
Cost per Sale = Cost / Number of Sales
This metric helps us understand how much it costs to acquire one sale. For example, if you know you can spend no more than $50 to acquire a sale, and in this case, the cost per sale is $69, that indicates poor performance, and changes are needed.
So, now we have a nice table that shows us how we’re performing and whether we’re on track or need to make adjustments.
In this part, we’ve built a simple report for tracking your marketing performance and have introduced key metrics like ROAS and Cost per Sale to evaluate how well your marketing is driving results. This dashboard helps you cut through the noise and focus on the numbers that truly matter, making it easier to track your ROI.
But we’re not done yet.
In the next part, we’ll dive deeper into how to make this dashboard even more actionable. We’ll look at how to turn those useless metrics into real insights, and make sure your marketing actually supports your business goals. So, keep an eye on it!
Thanks for reading! If there’s a specific topic you’d like me to cover, feel free to reach out at mantas@dabdabclick.com—always happy to dive into what matters most to you.


